Trajectory Inference: Pseudotime and Fate Probability¤
Duration: 15 min | Level: Intermediate | Device: CPU-compatible
Overview¤
Constructs a synthetic Y-shaped branching trajectory and applies DifferentiablePseudotime (diffusion maps) and DifferentiableFateProbability (absorption probabilities). Evaluates pseudotime ordering via rank correlation with ground truth and checks that fate probabilities correctly separate two terminal lineages.
Quick Start¤
Key Code¤
from diffbio.operators.singlecell import DifferentiablePseudotime, PseudotimeConfig

pt_config = PseudotimeConfig(n_neighbors=10, n_diffusion_components=5, root_cell_index=0)
pseudotime_op = DifferentiablePseudotime(pt_config, rngs=nnx.Rngs(0))

data = {"embeddings": embeddings}
pt_result, _, _ = pseudotime_op.apply(data, {}, None)
pseudotime = pt_result["pseudotime"]
Results¤
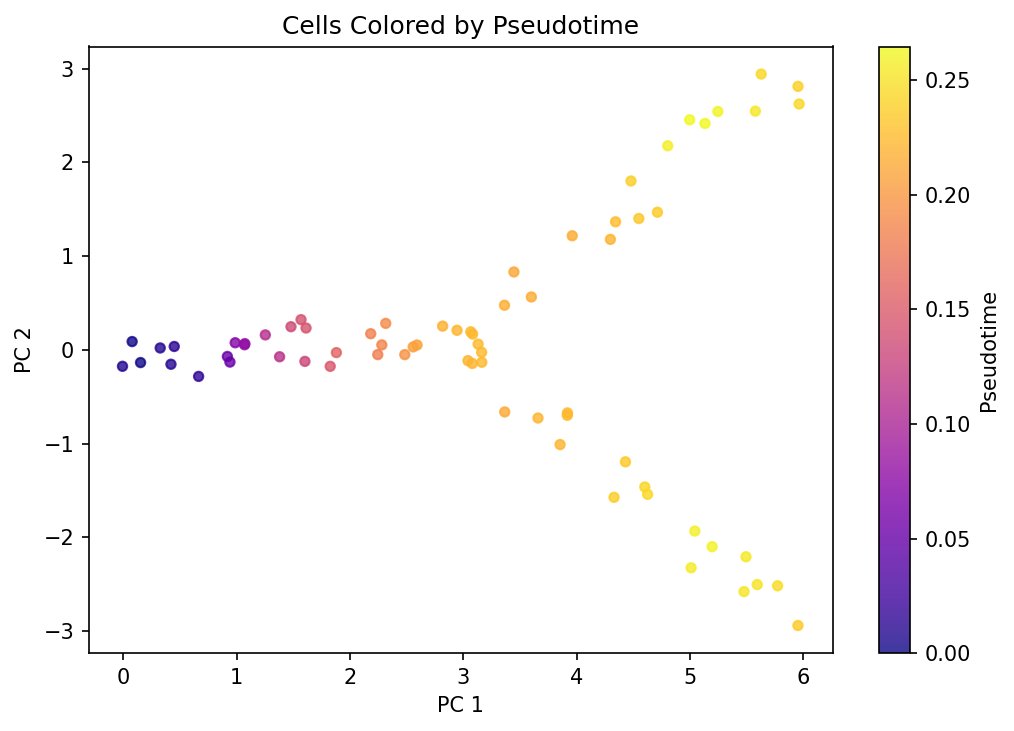
Scatter plot of the 2D trajectory colored by inferred pseudotime shows a smooth gradient from root (stem) to tips (branches), demonstrating correct temporal ordering with rank correlation 0.94.
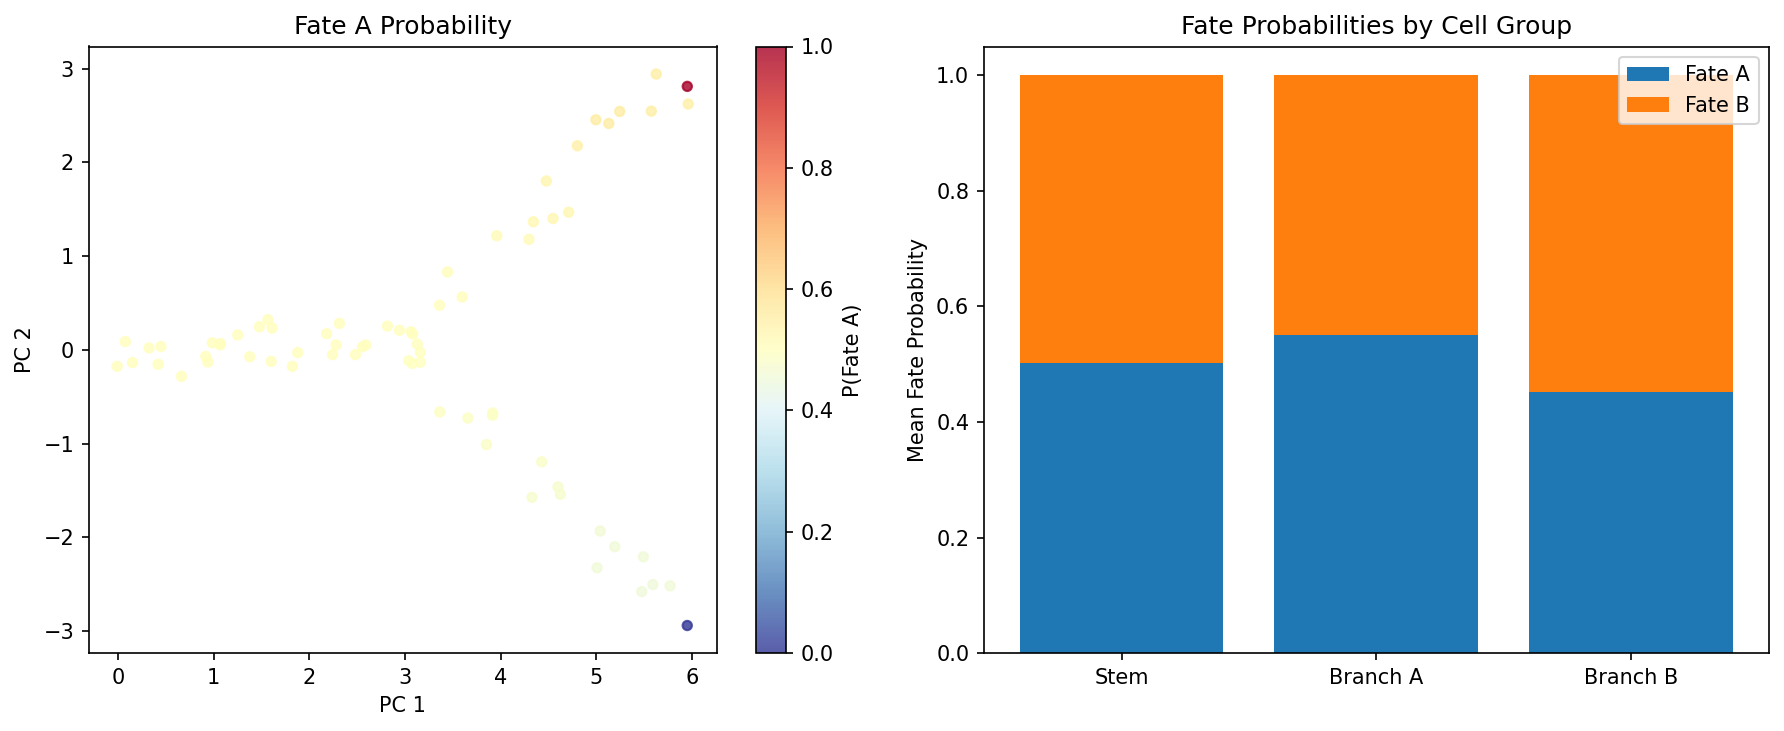
Left panel shows cells colored by fate A probability; right panel shows mean fate probabilities per cell group (stem, branch A, branch B), with terminal cells receiving probability 1.0 for their own fate.
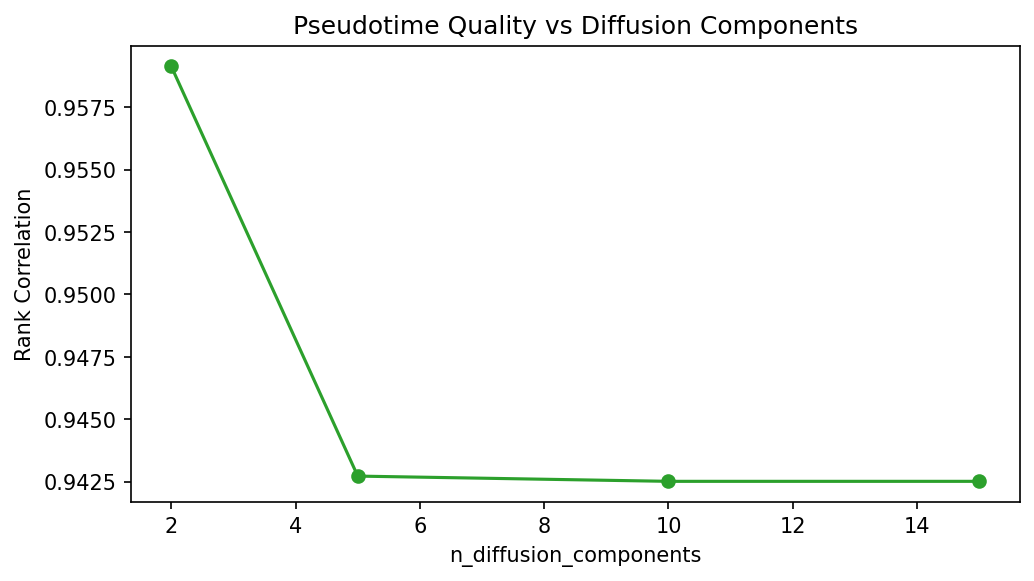
Rank correlation remains stable (0.94-0.96) across different numbers of diffusion components, with 2 components performing slightly best on this synthetic data.
Total cells: 70 (stem=30, branch_a=20, branch_b=20)
Embedding shape: (70, 20)
Pseudotime shape: (70,)
Pseudotime range: [0.0000, 0.2647]
Diffusion components shape: (70, 5)
Transition matrix shape: (70, 70)
Rank correlation (inferred vs true pseudotime): 0.9427
Root cell pseudotime: 0.000000 (should be 0)
Mean pseudotime - stem: 0.1170, branches: 0.2362
Fate probabilities shape: (70, 2)
Macrostates shape: (70,)
Fate probability row sums: min=1.0000, max=1.0000
Branch A cells -> fate A probability: mean=0.5508
Branch B cells -> fate B probability: mean=0.5478
Terminal A fate probs: [1.0, 0.0]
Terminal B fate probs: [0.0, 1.0]
Pseudotime operator gradients:
  Shape: (70, 20)
  Non-zero: True
  Finite: True
Fate probability operator gradients:
  Shape: (70, 70)
  Non-zero: True
  Finite: True
Pseudotime matches (eager vs JIT): True
Fate probabilities match (eager vs JIT): True
n_components -> Rank correlation with true pseudotime
-------------------------------------------------------
  n_components= 2: rank_corr=0.9591
  n_components= 5: rank_corr=0.9427
  n_components=10: rank_corr=0.9425
  n_components=15: rank_corr=0.9425
Next Steps¤
- Clustering -- soft k-means training
- Imputation -- MAGIC-style diffusion imputation
- API Reference: Single-Cell Operators